The 3D tab gives access to a number of dynamic reports: sets of fields that can be dragged and dropped onto a special "Pivot Grid" to quickly create an exportable report table.
Prefilter
Use the prefilter to decide which information to include in the report to begin with. Click the Prefilter button to bring up the Filter Builder.
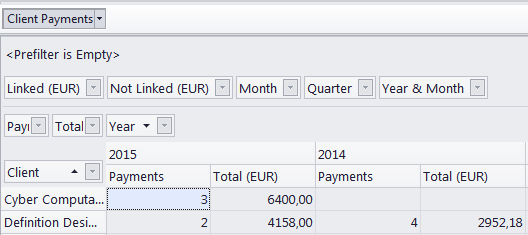
Pivot Grid
The pivot grid is the framework into which the fields can be dragged to customize the table.
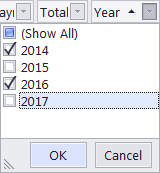
Click the down arrow button in a field to select the entries which will factor into the report by the values of that field.
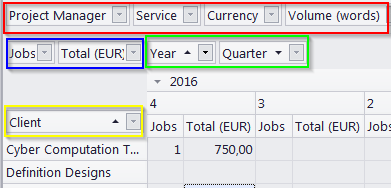
The grid consists of five areas:
The Field List contains the fields that are not displayed in the main window. Right-click a field and select Hide to send it to the Field List. Display the Field list by right-clicking just above the table and selecting "Show Field List".
Fields in the Filter Area (red box) do not appear in the table. but can be used for quick filtering.
Fields in the Data Area (blue box) display their values in the cells of the table. If there is more than one field in the Data Area, they appear as sub-columns of the field in the Column Area.
Fields in the Column Area (green box) split the data into columns according to their values. If there is more than one field in the Column Area, the columns are grouped with a left-to-right hierarchy and can be expanded or collapsed by clicking the arrow next to the left field's value.
Fields in the Row Area, (yellow box) split the data into rows according to their values. If there is more than one field in the Row Area, the rows are grouped with a left-to-right hierarchy and can be expanded or collapsed by clicking the arrow next to the left field's value.
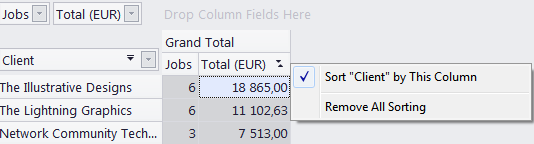
Sorting
By default, the table is sorted by the fields in the Row and Column Areas. Click the fields to switch between ascending and descending sorting.
You can also sort the table by the value of a specific row or column by right-clicking the column's header and selecting Sort... by This Row/Column.
Select Remove All Sorting to return to the default sorting method.

See also: