Note: This is a sample of FastReport engine functionality intended for users generally unfamiliar with SQL. For SQL-versed users it is recommended to refer to FastReport manual available for download on http://www.projetex.com/documentation
This topic will cover the process of creating a simple custom report.
Note: This is a sample of FastReport engine functionality intended for users generally unfamiliar with SQL. For SQL-versed users it is recommended to refer to FastReport manual available for download on http://www.projetex.com/documentation
Creating A Custom Report
1. Run the Projetex Server Administrator, turn the database offline and switch to the Corporate Settings tab.
2. Click Custom Reports on the Corporate Settings tab of the Projetex Server Administrator.
3. Click the New button; enter the report name and description in the New Custom Report window and click OK.
4. Add data which should be used in the report. To do so, on the Report menu click Data in the FastReport Designer window (it will open automatically, once you click the OK button).
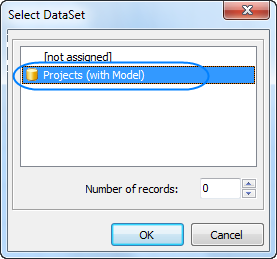
This will open the Select Project Datasets dialog window, in which all your custom queries are displayed. Select the required queries by selecting the check boxes in front of their names. For this example we selected the Projects (with Model) query, since we are composing a "Projects report".
Click OK to confirm selection.
Note: You can create your own custom queries with the help of the built-in query builder. Any custom queries created this way will appear in this dialog window.
5. Now, the contents of the selected query are displayed in the Data field to the right:
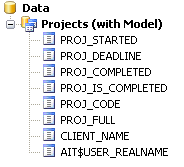
These are the fields from the Projetex database, which have been added to the query you selected. In this particular case, the fields are those containing project names (PROJ_FULL) and codes (PROJ_CODE), dates of the project timeline (PROJ_STARTED, PROJ_DEADLINE and PROJ_COMPLETED), information as to whether the project has been completed or not (PROJ_IS_COMPLETED) and corresponding client names (CLIENT_NAME).
6. Begin designing your report by placing Data Bands.
These “bands” bind the report elements together, specifying their location on the page relatively to the page itself and to the other bands. A more detailed description of the bands can be found in the FastReport User Manual. For this particular report you will need to use only a few of the bands available.
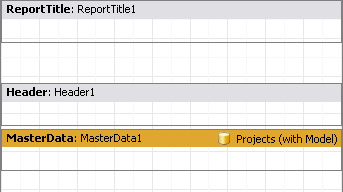
6.1. Click the Insert Band button and select the Report Title band. This will place the band into your report page. Click Insert Band again and select Header band to place it.
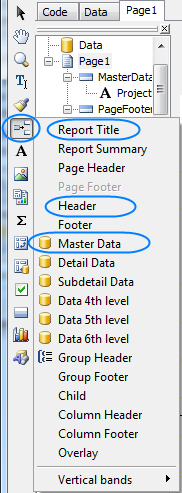
6.2. Click the Insert Band button one more time and select the Master Data band to place it in your report. When placing the Master Data band select your Projects (with Model) query when prompted to do so:
Your report page should look approximately like this:
|
Example:
|
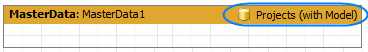
7. Adding data to the Master Data band.
To add a variable to your report, you will need to drag-and-drop the required fields from your query to the Master Data band.
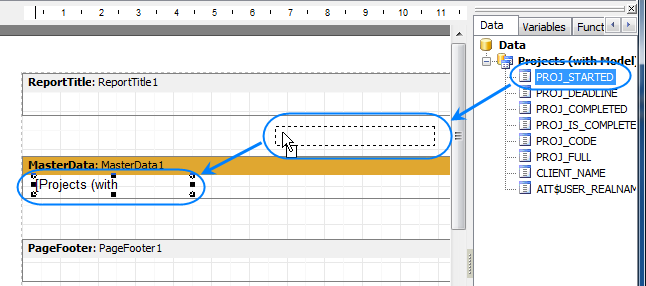
Any Master Data band can be linked to a specific dataset (or query in this case) only, so in case you have more than one query, be sure to drag and drop fields only to the Master Data band, which has been linked to this query.
|
Example: For example, the Master Data band below can contain fields from Projects (with Model) query.
|
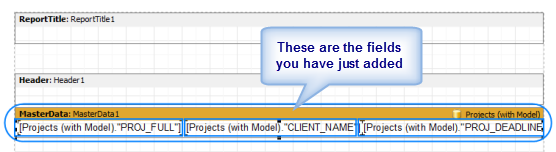
Drag sequentially the following fields from the Data area and place them inside the Master Data band in a row:
|
Example: PROJ_FULL, CLIENT_NAME, PROJ_DEADLINE |
When placed into your report, the fields take the form of text objects, like the example below:
|
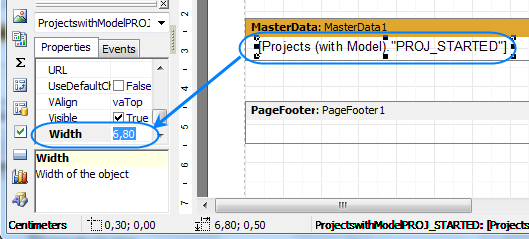
Example: [Projects (with Model)."PROJ_FULL"] |
These text objects act very much like the text variables in Projetex RTF templates.
Note: Some of these objects may be very wide. You can adjust their width by dragging the borders of these objects. Alternatively, you can enter the exact object length by selecting it and typing their width in the Properties area:
|
Example:
|
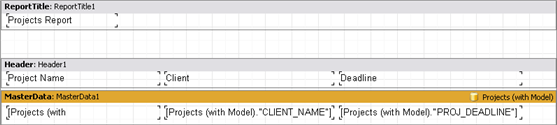
Once all the data has been added, your report should look like this:
|
Example:
|
8. Adding stationary data to other bands.
8.1. Add a header for your report by clicking the Text object button and placing the object on your report, within the Report Title band.
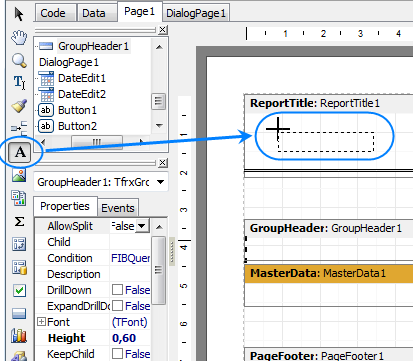
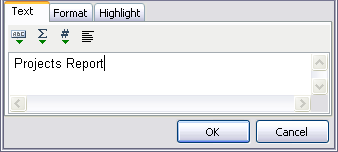
8.2. Type the header for your report in the memo window which appears.
8.3. Data will be displayed in your Master Data band in columns (each indicated by a field from the query). Add the names of these columns right above the query field objects in your Header band: Project name, Client, and Deadline the same way you added the header text object.
After this your report should look as follows:
|
Example:
|
9. Preview your report by clicking the Preview button.
Note: You can further configure the style of your report by configuring the style of text objects. Select the required text object and adjust its format in the Properties area to the left.
10. Save your newly created report by clicking the Save button and close the report designer.
Your new report is now ready to be used.
If you want to save this report in a separate file in the Reports folder of Projetex (so that you can send it to other Projetex users), select the report in the list and click the Save button.

See also: