The following Reports are included in Projetex 5D:
Client Reports
Show the Total funds invoiced by clients
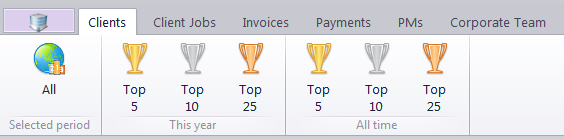
The All report adds up invoices within the Selected Period.
The Top 5/10/25 reports each come in two versions: This year and All time. They show the indicated number of clients with the greatest total invoices over either the current year or across the entire database. They also show the overall percentage of the displayed clients’ invoices in your gross revenue.
Client Job Reports
|
|
Jobs Chart |
A bar diagram showing the monthly total volume of jobs created for a specific client |
|
|
Jobs Table |
Similar to Jobs Chart, but presented as a table. |
|
|
Volume of Completed Jobs |
A table showing the total volumes of completed jobs, with columns representing months and rows representing volume units. |
|
|
Sales Table |
A table showing total sales for each month in the selected period. |
|
|
Sales chart |
A bar diagram showing the total monthly sales over the selected period. |
|
|
Total Sales by Clients |
Contains separate tables for each client, with the total volume and value of each “Group/service/unit” combination sold to each client. |
|
|
Sales History chart |
A bar diagram showing the total monthly sales over the entire history of the database. |
|
|
Sales History Report by Clients |
Shows the total volume and value of each unit type sold to each client over the entire history of the database. |
| Sales by Service | A pie diagram showing the percentage of specific services in the total sales volume. | |
| Sales by units |
A table showing the total volume and sum value of each kind of unit sold to all clients |
|
|
|
Income and Expense Report Table and List |
Reports showing monthly incomes and expenses, and totalling them to arrive at the overall balance. The two reports differ mainly in layout. |
Invoice Reports
|
|
Invoice Register |
Contains tables showing basic information on all invoices issued to each client (Date issued, Date due, number, total, paid amount, currency). |
|
|
Customer ledger |
A table showing the total payments received from each client, further added up to totals in each currency and the grand total in the base currency. |
|
|
Sales chart |
A bar diagram showing the total monthly sales (based on invoices) over the selected period. |
|
|
Sales History chart |
A bar diagram showing the total monthly sales (based on invoices) over the entire history of the database. |
Payment Report
|
|
Sales History chart |
A bar diagram showing the total monthly sales (based on payments) over the entire history of the database. |
|
|
Sales chart |
A bar diagram showing the total monthly sales (based on payments) over the selected period. |
|
|
Sales List |
A chronological list showing the linked invoice numbers, Client job names and numbers, and the amounts paid for each payment over the selected period. |
|
|
Account Receivable |
Shows the totals of expected payments from each client. |
|
|
Customer ledger |
A table showing the total payments received from each client, further added up to totals in each currency and the grand total in the base currency. |
|
|
Income Report #1 |
Shows a list of all payments issued over the selected period, with issue date and total in both client’s currency and base currency. |
|
|
Income Report #2 |
A table of monthly payment totals from all clients, in the base currency. |
|
|
Cash Flow Table and List |
Two reports showing monthly payments from client and to experts, and totalling them to arrive at the overall balance. The two reports differ mainly in layout. |
PM Reports
|
|
Completed Client Jobs |
The total volume of client jobs completed in the selected period by each PM, separated by year, month and unit. |
|
|
POs Register |
A list of all POs given to each freelancer over the selected period, with totals for each currency and a grand total. |
|
|
Efficiency |
A Productivity review for a specific PM over the selected period (projects completed, total payments received and given, total income for the company |
Corporate Team Reports
|
|
Top 5 |
Shows the Top 5 experts by the total value produced and their percentage of total gross production by all Corporate Experts over the selected period |
|
|
Jobs Completed by Expert |
Shows details of Jobs completed by a specific expert in a specific month and their total value for that month. |
|
|
Cost of Jobs |
Shows the total cost of all Corporate jobs completed by each expert over the selected period. |
|
|
Breakdown of Services Provided |
A pie diagram showing the percentage of specific services provided by corporate experts. |
|
|
Volume of Completed Jobs |
The total volume of corporate jobs completed in the selected period by each Expert, separated by year, month and unit. |
|
|
Average Output by Expert |
Shows the total Volume produced and time spent by each expert, separated by service provided. |
|
|
Personal Output |
Shows the details of jobs (Code, Name, Service, Volume, Time Spent, Timeline and Productivity (Volume/Time). You can select a specific Expert and\or volume unit to display, and determine whether to include only Completed jobs. |
|
|
Average Output by Service |
Shows the total Volume, Time spent and Productivity for each service performed by the company, separated by Expert. |
Freelancer Reports
|
|
Volume of Completed Jobs |
The total volume of freelance jobs completed in the selected period, separated by year, month and unit, with grand totals for each unit type. |
|
|
Jobs Chart by Expert |
A bar diagram showing the monthly total value of jobs completed by a specific expert over the selected period. |
|
|
Orders Distribution |
Shows the payments terms, totals of jobs completed in the selected period, taxes withheld, the funds to transfer and the currency for each freelancer |
|
|
Average Output by Expert |
Shows the total Volume produced and each freelance expert, separated by year, month, and unit type. |
|
|
POs Register |
A list of all POs given to each freelancer over the selected period, with totals for each currency and a grand total. |
|
|
Payments Made |
Shows a chronological list of all payments made to freelancers over the selected period, with totals for each currency and a grand total. |
|
|
Outstanding POs |
Shows a list of unpaid or partially paid POs over the selected period, with totals for each currency and a grand total. |
|
|
Future Payments |
Shows the total amount of expected freelancer payments in two lists, one separated by freelancers, the other separated by date. |
5D Reports
![]()
The 5D tab contains Dynamic Reports: presets for the Pivot Grid, which can be customized, sorted and filtered to display only the relevant information before being exported to any compatible format. Each of the reports available has a unique set of fields which can be placed into the Pivot Grid.
Form left to right, the reports create summaries on the following:
-
Corporate, Freelance and Client Jobs
-
Projects headed by PMs with currently active Projetex user accounts, or by all PMs regardless of account status
-
Job Assignments, Purchase Orders and Invoices
-
Payments given to corporate or freelance experts, or received from clients.